functional plot and image plot.
Functional plot
$f(x,y)$라는 function으로 image를 모델링할 수 있음.
2개의 독립변수 $x,y$의 함수로 볼 경우, 3D graphics로 그릴 수 있음.
2개의 독립변수에 의해 intensity 또는 brightness가 결정됨.
(color 의 경우엔 dependent variable이 여러개로 vector라고 볼 수 있음)
다음은 matplotlib 로 functinal plot 을 수행하는 code snippet 임.
from scipy import datasets
import cv2
import numpy as np
import matplotlib.pyplot as plt

img = datasets.face()
img_gray = img[...,0]
# img_gray = cv2.cvtColor(img, cv2.COLOR_RGB2GRAY)
h,w = img_gray.shape
x,y =np.mgrid[0:h,0:w]
print(f'{h=},{w=}')

fig =plt.figure(figsize=(4,4))
ax = fig.add_subplot(1,1,1,projection='3d') #Axes3D 객체.
surf = ax.plot_surface(
    x,y,img_gray,
    cmap=plt.cm.gray,
    rstride=15, cstride=15,
    )

#ax.set_zticks([]);ax.set_yticks([]);ax.set_xticks([])
ax.set_xlabel(r'$x$', fontsize=11)
ax.set_ylabel(r'$y$', fontsize=11)
ax.set_zlabel(r'$z$', fontsize=11)


# 80 : the elevation angle in the z plane (in degrees).
# 20 : the azimuth angle in the (x, y) plane (in degrees).
ax.view_init(80,20)
cb = fig.colorbar(surf, ax=ax, shrink=.5)
다음은 결과 graph 임.

Image Plot
하지만 일반적으로는 image plot 으로 처리하며 보통 imshow를 이용함.
$f$ 는 image 이며, $(x,y)$는 pixel (=picture element) 라고 불림.
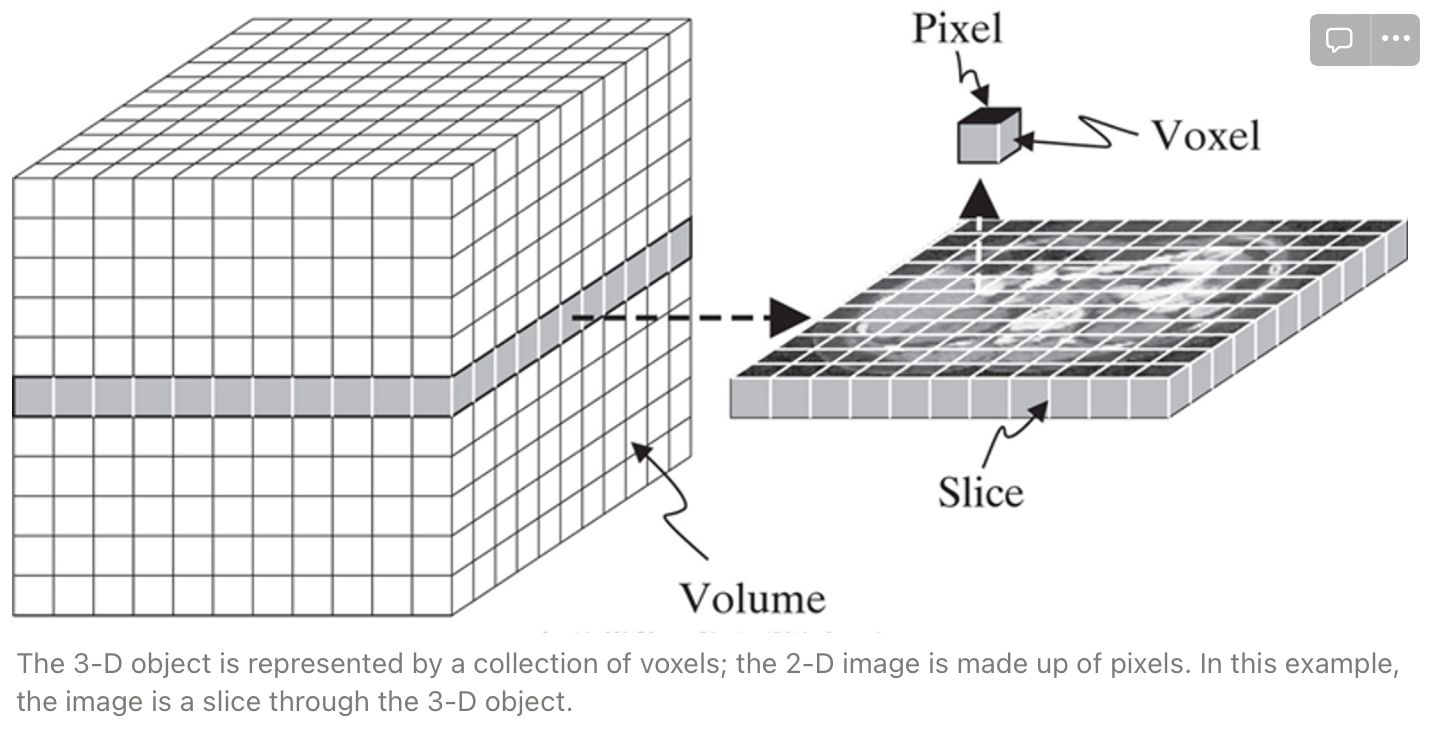
의료 데이터의 경우는 여러 image가 쌓여있는 volume을 이루며, 이 경우에는 voxel 이라고 불림.
다음은 이를 matplotlib 의 imshow 로 나타내는 code snippet 임.
plt.imshow(img_gray, cmap='gray')
plt.axis('off')
결과는 다음과 같음.

다음 그림은 pixel과 voxel, slice 의 개념을 잘 보여줌.
Ref. Medical Imaging Signals and Systems, 2nd Ed. : https://www.pearson.com/en-us/subject-catalog/p/medical-imaging-signals-and-systems/P200000003390/9780137982028
같이 읽어보면 좋은 자료들
https://gist.github.com/dsaint31x/bf88f3dfc2491aa6594a1fe8c17f4754
matplotlib_how-to-use-plot_surface.ipynb
matplotlib_how-to-use-plot_surface.ipynb. GitHub Gist: instantly share code, notes, and snippets.
gist.github.com
https://ds31x.blogspot.com/2023/09/dip-digital-image-processing.html
[DIP] Digital Image Processing 이란?
Image의 표현 : 함수 Image는 2개의 독립변수 $x,y$를 가지는 function $f(x,y)$로 정의 할 수 있음. 2차원 vector $\textbf{r}=\langle x,y \rangle$를 독립변수로 나타내는 경우도 많음. $\te...
ds31x.blogspot.com
'Programming > DIP' 카테고리의 다른 글
| [CV] Homography 에 대해서 (0) | 2024.06.13 |
|---|---|
| cv.cornerSubPix : 코너 검출 정확도 향상 (0) | 2024.06.12 |
| [DIP] Image Quality 관련 정량화 지표들: Resolution, Contrast, SNR (0) | 2023.10.04 |
| [DIP] Function plot and Image display (0) | 2023.09.26 |
| [DIP] Radial distortion : barrel and pincushion distortions (0) | 2023.09.26 |