HalfNormal distribution(반정규분포)은
- 평균이 0인 Normal distribution에서 음수 값을 제거한 뒤,
- 남은 확률밀도를 다시 정규화하여 만든 확률분포.
가능한 값은 항상 0 이상이며,
standard deviation(표준편차)와 같이 음수가 될 수 없는 parameter(모수)를 표현하는 데 널리 사용됨.
(PyMC 등의 MCMC 기반 Bayesian framework 에서 prior distribution으로 자주 사용됨.)
정규분포에서 HalfNormal 분포로
mean, $\mu=0$ 이고 standard deviation 이 $\sigma$인 normal distirbution 은 다음과 같이 표기됨:
$$
Z \sim \mathcal{N}(0,\sigma^2)
$$
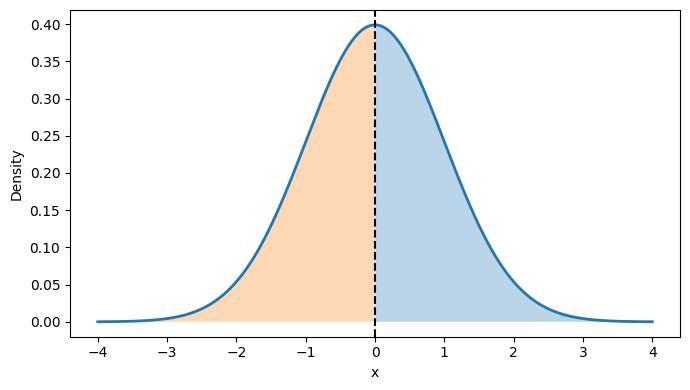
Normal distribution(정규분포)는
- 0을 중심으로 좌우가 대칭이며,
- 전체 면적은 1이다.
- 따라서 양수 영역과 음수 영역의 면적은 각각 0.5를 차지.
code:
import numpy as np
import matplotlib.pyplot as plt

sigma = 1

x = np.linspace(-4, 4, 1000)

pdf = (
    1/(sigma*np.sqrt(2*np.pi))
    * np.exp(-x**2/(2*sigma**2))
)

plt.figure(figsize=(7,4))
plt.plot(x, pdf, lw=2)
plt.fill_between(x, pdf, where=(x>=0), alpha=0.3)
plt.fill_between(x, pdf, where=(x<0), alpha=0.3)
plt.axvline(0, ls="--", color="k")
plt.xlabel("x")
plt.ylabel("Density")
plt.tight_layout()
plt.show()
HalfNormal distribution은 Normal distribution에서 절댓값을 취한 분포와 동일:
$$ X=|Z| $$
즉, 다음이 성립:
$$
Z\sim\mathcal N(0,\sigma^2) \\
X\sim\operatorname{HalfNormal}(\sigma)
$$
- 음수 영역의 확률이 모두 양수 영역으로 접히므로,
- 양수 영역의 확률밀도는 기존 Normal distribution 보다 두 배 커진다.
$$
f_{\text{HalfNormal}}(x) = 2f_{\text{Normal}}(x), \qquad x\ge0
$$
HalfNormal의 확률밀도함수 (PDF)
HalfNormal distribution의 확률밀도함수는 다음과 같음:
$$
f(x) =
\sqrt{\frac{2}{\pi}}
\frac1{\sigma}
\exp\left(
-\frac{x^2}{2\sigma^2}
\right),
\qquad x\ge0
\\
\text{where, } \\
f(x)=0,\qquad x<0
$$
- 곡선 아래의 전체 면적은 1이며,
- 확률밀도는 $x=0$에서 가장 크고 이후 계속 감소.

import numpy as np
import matplotlib.pyplot as plt

sigma = 1

x = np.linspace(0,4,1000)

pdf = (
    np.sqrt(2/np.pi)/sigma
    * np.exp(-x**2/(2*sigma**2))
)

plt.figure(figsize=(7,4))
plt.plot(x,pdf,lw=2)
plt.fill_between(x,pdf,alpha=0.3)
plt.scatter([0],[pdf[0]],color="red")
plt.xlabel("x")
plt.ylabel("Density")
plt.tight_layout()
plt.show()
$\sigma$ 의 의미
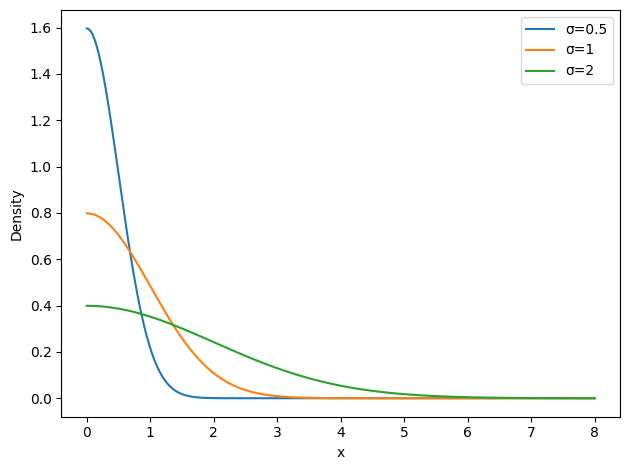
$\sigma$는 분포가 얼마나 넓게 퍼질지를 결정하는 scale parameter 임:
- 작은 $\sigma$: 대부분의 값이 0 근처에 집중된다.
- 큰 $\sigma$: 큰 값도 비교적 자주 허용된다.
아래 그림은 서로 다른 $\sigma$의 HalfNormal 의 예를 보여줌:
import numpy as np
import matplotlib.pyplot as plt

x = np.linspace(0,8,1000)

for sigma in [0.5,1,2]:
    pdf = (
        np.sqrt(2/np.pi)/sigma
        * np.exp(-x**2/(2*sigma**2))
    )
    plt.plot(x,pdf,label=f"σ={sigma}")

plt.xlabel("x")
plt.ylabel("Density")
plt.legend()
plt.tight_layout()
plt.show()
Bayesian 분석에서의 활용
HalfNormal distribution은 항상 양수만 가지므로 음수가 될 수 없는 parameter 의 prior(사전분포)로 자주 사용됨.
대표적인 예는 다음과 같다.
- 랜덤효과의 표준편차
- 측정오차의 표준편차
- 그룹 간 변동성
예를 들어 PyMC에서는 다음과 같이 정의할 수 있다.
sigma_patient = pm.HalfNormal(
    "sigma_patient",
    sigma=1.0
)
위의 코드에서 sigma_patient(환자 간 변동의 표준편차)는
- 반드시 0 이상이며,
- 작은 값을 더 선호하지만
- 데이터가 충분하면 더 큰 값도 허용한다는 사전의 믿음(?)을 의미 = prior.
같이보면 좋은 자료
https://distribution-explorer.github.io/continuous/halfnormal.html
Half-Normal distribution — Probability Distribution Explorer documentation
Story The Half-Normal distribution is a Normal distribution truncated to only have nonzero probability density for values greater than or equal to the location of the peak.
distribution-explorer.github.io
2023.10.25 - [.../Math] - [Math] Normal Distribution (정규분포, Gaussian Distribution)
[Math] Normal Distribution (정규분포, Gaussian Distribution)
Normal DistirbutionGaussian Distribution, Laplace-Gaussian Distribution 라고도 불림. 특히, mean=0이고, std=1인 경우, Standard Normal Distribution이라고 불림.1. 정의Normal Distribution의 pdf (probability density function)는 다음과
dsaint31.tistory.com
2025.05.27 - [.../Math] - Bayes' Theorem (Update Your Beliefs with Evidence)
Bayes' Theorem (Update Your Beliefs with Evidence)
1. 정리$N$개의 event (사상,사건)인 $H_0, H_1, ... , H_{N-1}$ 들이sample space $S$의 partition(전부 모이면 $S$를 이룸)이면서,$P(H_i) >0$ 을 만족하고,Event $E$가 sample space $S$의 임의의 Event이며 $P(E)>0$이면 다음이
dsaint31.tistory.com
2024.04.18 - [.../Math] - [Math] Probability Distribution
[Math] Probability Distribution
Probability Distribution : Probability Distribution은 특정 random variable(확률 변수)이 취할 수 있는 각각의 값에 대한 확률을 나타내는 분포임.Probability Distribution Function (PDF)으로 기술되며,random variable이 어떤
dsaint31.tistory.com
'... > Math' 카테고리의 다른 글
| Matrix Norm and Condition Number (1) | 2025.10.29 |
|---|---|
| Independent Poisson variables의 합과 상수곱 (0) | 2025.10.14 |
| Error Propagation (or Delta Method) (0) | 2025.10.08 |
| sampling error vs. sampling bias (0) | 2025.09.16 |
| Bayes' Theorem (Update Your Beliefs with Evidence) (0) | 2025.05.27 |