Object Recognition(물체 인식)이나 증강현실 (”장면영상”에서 model에 matching되는 객체를 찾음)의 경우 다음이 일반적.
- Model Image:
- key point가 적은 편. (적은 수의 feature vector를 가짐.)
- n개의 keypoints 를 가진다고 가정
- Scene Image(장면영상):
- 매우 많은 objects 와 다양한 배경이 혼재. (많은 수의 feature vectors 를 가짐.)
- m개의 keypoints 를 가진다고 가정

matching에서는 model image 와 scene image 간에 1:1 correspondance 여부 검사를 여러 차례 수행
- 앞서 model image의 keypoints의 수를 n개라고 하고, scene image에서의 keypoints 의 수를 m개라고 한 경우,
- 1:m matching 을 n번 수행
- 이는 Linear Search 를 사용한 경우이고 space partitioning approaches 을 사용할 경우 검사 횟수를 줄일 수 있음.
1. Matching Strategies
1-1. Fixed Thresholding
The simplest matching strategy
다음 조건 만족시 $\textbf{x}$와 $\textbf{y}$를 matching으로 판정.
$$
d(\textbf{x},\textbf{y}) < \text{Th}
$$
- $d(\mathbf{x},\mathbf{y})$: $\textbf{x}$와 $\textbf{y}$의 distance.
- $\text{Th}$: Threshold 값.
1-2. Nearest Neighbor
NN을 찾아서 matching되는 점으로 판정.
- 즉, 모델의 feature vector $\textbf{x}$와 가장 가까운 feature vector를 가지는 장면영상의 object를 매칭으로 판정
- 물론 해당 페어의 difference가 정해진 Threshold보다는 낮아야 함.
일반적으로,
- Nearest Neighbor Search를 수행하고 얻은 Nearest Neighbor 에 대해
- “Fixed Threshoding”을 수행하여 matching 이 수행됨.
2024.11.16 - [Computer/CE] - [CE] Linear Search, Naive Search, Brute Force Search
[CE] Linear Search, Naive Search, Brute Force Search
Linear Search (Naive Search)The simplest solution to the Nearest Neighbor Search problem is to compute the distance from the query point to every other point in the database, keeping track of the "best so far".이 방식에서는 모든 가능한 데이터
dsaint31.tistory.com
2024.11.25 - [Programming/ML] - [ML] Nearest Neighbor Search: k-d Tree
[ML] Nearest Neighbor Search: k-d Tree
1. 소개1975년 Nearest Neighbor Search를 위해Binary Search Tree (BST)의 개념을 활용하여k-diemensional vector space에서 동작하도록Bently가 제안한 알고리즘.Lowe와 Muja가 2014년 제안한 FLANN 에서는보다 개선된 Multiple
dsaint31.tistory.com
1-3. Distance ratio of Nearest Neighbor
Distance가 가장 적은 점, $\textbf{y}_\text{first}$ 와 두번째로 적은 점의 distance, $\textbf{y}_\text{second}$의 비율을 이용하여 매칭을 판단.$$
\dfrac{d(\textbf{x},\textbf{y}_\text{first})}{d(\textbf{x},\textbf{y}_\text{second})}<\text{Th}
$$
- 이 경우에도, ratio가 정해진 Threshold $\text{Th}$보다는 낮아야 함.
- 아래의 공식에 해당시 matching 성립.
- 여러 연구자들의 논문에 따르면 최근접 거리 비율이 가장 높은 성능을 보임. ← SIFT 의 경우도 이 방식($\text{Th}=0.8$ 이하면 신뢰할 수 있는 correspondence로 처리)을 채택함.
참고: Lowe 2004, Distinctive Image Features from Scale-Invariant Keypoints
2. Matching Evaluation: ROC Curve
Matching 과정은 결국 두 feature vector가
- 실제로 같은 물체에서 온 것인지 (correspondence)
- 아닌지를 판별하는
일종의 (binary) classification 문제로 볼 수 있음.
이러한 관점에서, classifier 의 성능을 평가하는데 널리 사용되는
ROC Curve나 Confusion Matrix등을 통해 성능 평가가 가능함.
2-1. Matching에서의 ROC Curve
다음의 Receiver Operating Characteristic (ROC) Curve 를 사용하여 matching 성능을 비교할 수 있음.
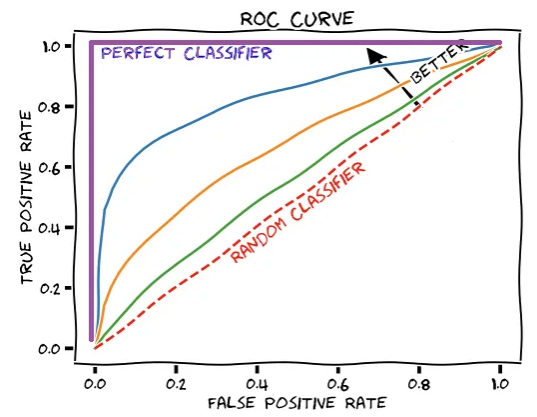
$$\begin{aligned}TPR &= \dfrac{TP}{TP+FN} &(= \text{Sensitivity}) \\FPR&=\dfrac{FP}{FP+TN} &= 1-\dfrac{TN}{FP+TN}=(1-\text{Specificity})\end{aligned}$$
- True Positive: Th 를 넘어서 matching 이라고 판정된 것이 실제로 correspondence 인 경우.
- True Negative: Th 를 넘지 못해서 matching 이 아니라고 판정한 것이 실제로도 아닌 경우.
- False Positive: Th 를 넘어서 matching 이라고 판정했으나 실제로는 correspondence 가 아닌 경우.
- False Negative: Th 를 넘지 못해서 matching 이 아니라고 판정한 것이 실제로는 correspondence 인 경우.
ROC Curve에서 Area under Curve (AUC)가 큰 경우
높은 성능을 의미함 (최대값은 1임).
Threshold 가 작은 경우부터 시작하여 점차 증가시키면서 곡선을 그려나가면,
ROC Curve의 오른쪽 상단에서 시작하여 왼쪽 하단 부분으로 그려짐.
2-2. False Positive Rate (Alpha Error Rate)
참고로 False Positive Rate는 일종의 Type I Error Rate임.
- 실제로는 거짓 인데, 참 으로 판정한 오류를 Type I Error 라고 함.
- Matching에서는
- 실제로 correspondence 가 아닌데, matching 이라고 잘못 판정한 경우.
- matching 이라고 찾은 경우 중에서 outlier 및 error들이 바로 False Positive임.
- $\text{Th}$가 낮을수록 이들이 많아지며 False Positive Rate 가 커짐.
- 가설검증에서는
- null hypothesis (귀무가설) 이 참인데, 이를 기각하고 alternative hypothesis 를 채택한 경우.
- Type I Error 는 Alpha Error라고도 불림 (다른 이름으로는 Fall Out도 있음).
참고자료
https://glassboxmedicine.com/2019/02/23/measuring-performance-auc-auroc/
Measuring Performance: AUC (AUROC)
The area under the receiver operating characteristic (AUROC) is a performance metric that you can use to evaluate classification models. AUROC tells you whether your model is able to correctly rank…
glassboxmedicine.com
BME228
Performance Measures for Classifiers Confusion matrix Confusion matrix(오차행렬, 혼동행렬)은 row는 label의 ideal class 를 나타내며, column은 predicted class 를 나타낸다. Confusion matrix는 Classifier의 성능을 확실하게 파악
dsaint31.me
'Programming > DIP' 카테고리의 다른 글
| Digitization (0) | 2025.06.22 |
|---|---|
| [DIP] Nearest Neighbor Search: Locality Sensitive Hashing (0) | 2024.11.26 |
| [DIP] Least Square Method for Fitting (0) | 2024.11.25 |
| [Math] Maximum Likelihood Estimator: M-Estimator (0) | 2024.11.25 |
| [OpenCV] K-Means Tree Hyper-parameters: FLANN based Matcher (1) | 2024.11.25 |